 Man sieht den Graphen von f(x)=x³-x².
© Gunter Heim => Zurück zum Artikel
Man sieht den Graphen von f(x)=x³-x².
© Gunter Heim => Zurück zum Artikel
Globalen Extrempunkt berechnen
Bildinfo und Lizenz
Bildinfo
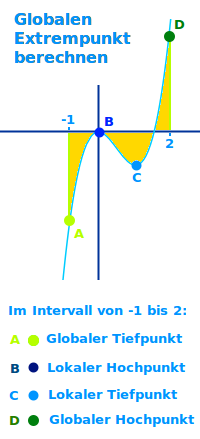
- Man sieht den Graphen von f(x)=x³-x².
- Eingetragen ist das Intervall von -1 bis 2.
- Er hat einen globalen Tiefpunkt bei (-1|-2).
- Er hat einen lokalen Hochpunkt bei (0|0).
- Er hat einen lokalen Tiefpunkt bei etwa (0,667|-0,148)
- Er hat einen globalen Hochpunkt bei (2|4).
Source
- Created: October 28th, 2019
License
- This image is in the Public Domain.
- You may use it, redistribute and modify it in any way.
- You may but do not need to attribute the author of this image.
Warranty
- No guarantee can be given as to the correctness of facts implied or explicitly stated.
- Usage is completey at your own risk. 💣
Originalseite
- Das Bild ist Teil eines online-Lexikons.
- Rhetos Lernlexikon Mathematik, Aachen: