 Eine typische Binomialverteilung als Säulendiagramm
© Gunter Heim => Zurück zum Artikel
Eine typische Binomialverteilung als Säulendiagramm
© Gunter Heim => Zurück zum Artikel
Standardabweichung aus Binomialverteilung
Bildinfo und Lizenz
Bildinfo
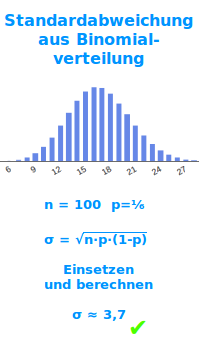
- Eine typische Binomialverteilung als Säulendiagramm
- Die x-Achse ist skaliert von 0 bis 27.
- Man sieht je eine hohe Säule bei x=16 und x=17.
- Links und rechts davon werden die Säulen hügelförmig kleiner.
- Die zugrundeliegende Binomialverteilung ist charakterisiert durch:
- Man sieht darunter die Formel für die Standardabweichung klein Sigma.
- Der berechnete Wert ist etwa: 3,7
- Das ist hier die Standaradabweichung.
Source
- Created: October 10th, 2020
License
- This image is in the Public Domain.
- You may but do not need to attribute the author of this image.
Warranty
- No guarantee can be given as to the correctness of facts implied or explicitly stated.
- Usage is completey at your own risk. 💣
Originalseite
- Das Bild ist Teil eines online-Lexikons.
- Rhetos Lernlexikon Mathematik, Aachen: